Powell River BC Jan - May 2017 Real Estate Sales Statistics
At last! 2017 real estate statistics!
Powell River started the year with a bang - residential units up 15.8% month-over-month and 57.1% year-over-year. February drew back ending with both indicators in the red; but, March roared with sales up 73.7% month-over-month and 26.9% year-over-year. Then, damn, someone let the dogs out! Sales petered in April and went flat in May.

But, look at the 12-month rolling chart - it shows sales falling and falling steeply. The purpose of a 12-month rolling report is to show trend. According to one business website:
“A Rolling 12 Month Trend report does not sound too exciting but it is a valuable tool for any organization to use to track its progress and to show trends. Essentially, it is a report that uses the running total of the values of last 12 months of an indicator. Each month, the indicator that is 13 months old is dropped from the total and the new month’s indicator value is added.(Another excellent explanation with example can be seen here.)
Why use this trend report rather than looking at the actual values? Well, the actual values are important for many reasons but they do not show any trends that can point to growth, flattening or decline.”
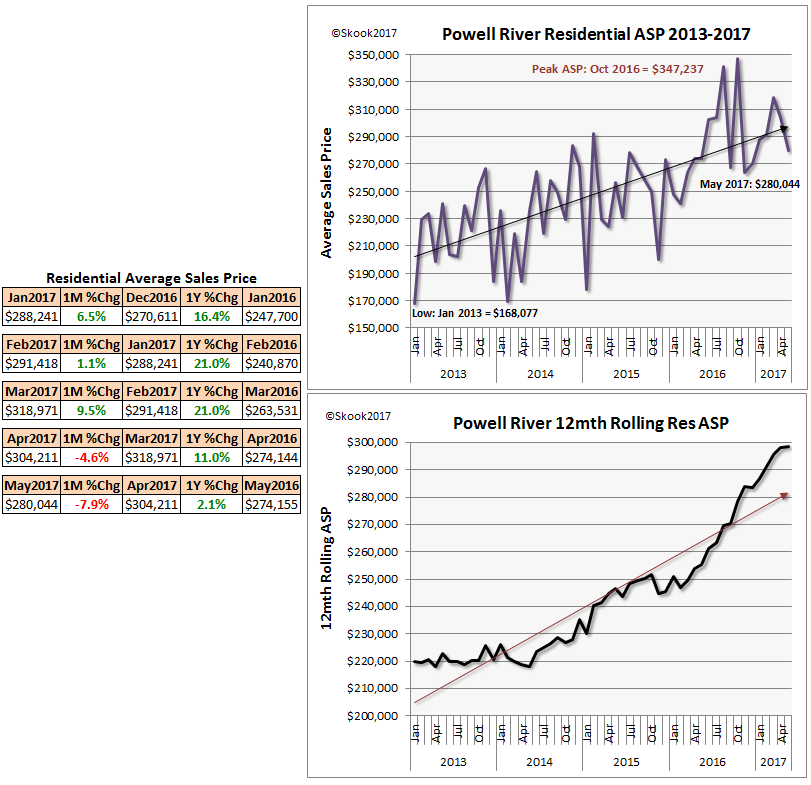
So the trend chart shows sales peaked in Sep 2016, went into decline, had a dead-cat bounce, and they’re back to falling and at steeper rate then the last serious decline in late 2014.

The residential average sales price reached a zenith in October 2016 ($347,714) and doesn’t appear too interested in equalling or surpassing the mark.

The 12-month rolling ASP chart shows the trend has been ever upward. That is until this April and May when it went flat.
Now, are Average Sales Prices going to pick up again? Maybe not. The number of Active Listings jumped 16.8% and appears to be gathering momentum. It’s highly possible investment properties bought in 2014/2015 are coming back on the market - they are on the lower Sunshine Coast. This will be a chart to watch.

Powell River remains a Buyer’s Market in 2017 according to the Sales-to-Active Listing Ratio. However, if sales are falling and more listing get thrown on the market this could change quickly.

June stats will be critical in determining if the party is over in Powell River. The BCREA will release them July 14th. Stay tuned.
No comments:
Post a Comment
My first inclination was to moderate to avoid trolling; however, l'll now take a wait and see attitude. Comments will appear as soon as published. If I start seeing garbage comments, I'll flick the switch and return to moderating. Skook